

A/B Experiments
The "A/B Experiments" module makes it possible on the one hand to test configurations of Makaira in a data-driven manner and on the other hand to play out different versions in the frontend. For example, different buyboxes or different page structures can be tested against each other.
For this purpose, the visitors to your website are divided into two groups - an A group, which receives the original setting, and a B group, which receives a different configuration. We also refer to this as the A and B scenarios.
By simultaneously tagging the users in Makaira Tracking, the optimal configuration can then be found. The following metrics are available for detailed evaluation:
- Orders — number of completed ecommerce orders
- Bought products — number of products bought (conversions)
- Revenue — turnover generated by the variant
- Bounces — bounce rate of the variant
- Average Visit Length — average time visitors spent on the site
The exact meaning of each metric and of every value in the result table and chart is described in Reading the results below.
Currently, in addition to pure frontend tests, the ranking mix and machine learning/personalization are available for A/B testing. Other Makaira features will be further developed bit by bit for A/B test compatibility.
Requirements
- Use of a current version of Makaira Connect (from version 2.6.4) or Makaira Connect Legacy (from version 2021.2.3) or the current Makaira Storefront
- Makaira tracking is active (see Tracking -> Integrationen bzw. A/B-Testing-Tag für Google Tag Manager)
A/B test setup
- Switch to "A/B experiments" in the makaira
- Create a new A/B experiment
- Store all necessary test information
- Select traffic distribution (minimum 1% must remain with the original traffic).
ATTENTION: Traffic distribution can not be changed after setup, so that the data can be evaluated correctly! - Save.
Configuration of the "B scenario"
This section is only relevant if you want to A/B test a Makaira configuration
The default configuration, which you can store in Makaira as usual, is always the "A" scenario
You can edit the "B scenario" by going to the A/B experiment list and clicking on "Configure". Makaira now switches to the configuration interface for the "B scenario" - recognizable by a yellow frame. Here you can only change the configuration that you have selected for the A/B testing, the menu is thinned out accordingly.
When you are done with the configuration, you can return by clicking "Finish editing" at the top.
Start of the A/B experiment
Before you start the A/B experiment, check again whether all settings in the original (A variant) and in the B variant (see "Configuration of the B scenario") are stored correctly. Subsequent changes can lead to falsified test results!
Currently only one experiment can run per instance!
When you are ready, click on "Start Experiment". Now your customers will be served A or B scenarios based on the traffic classification you made.
You can always tell if an A/B experiment is running because a yellow badge is played in the menu bar at the top.
When you think you have collected enough data, you can stop the experiment by clicking the "Stop experiment" button. From this moment on, only the original (the A-scenario) will be played.
Evaluation of the A/B experiment
As long as an A/B experiment is running and after its completion, you can view the experiment results at any time. Just click on the small statistics icon in the A/B experiment overview.
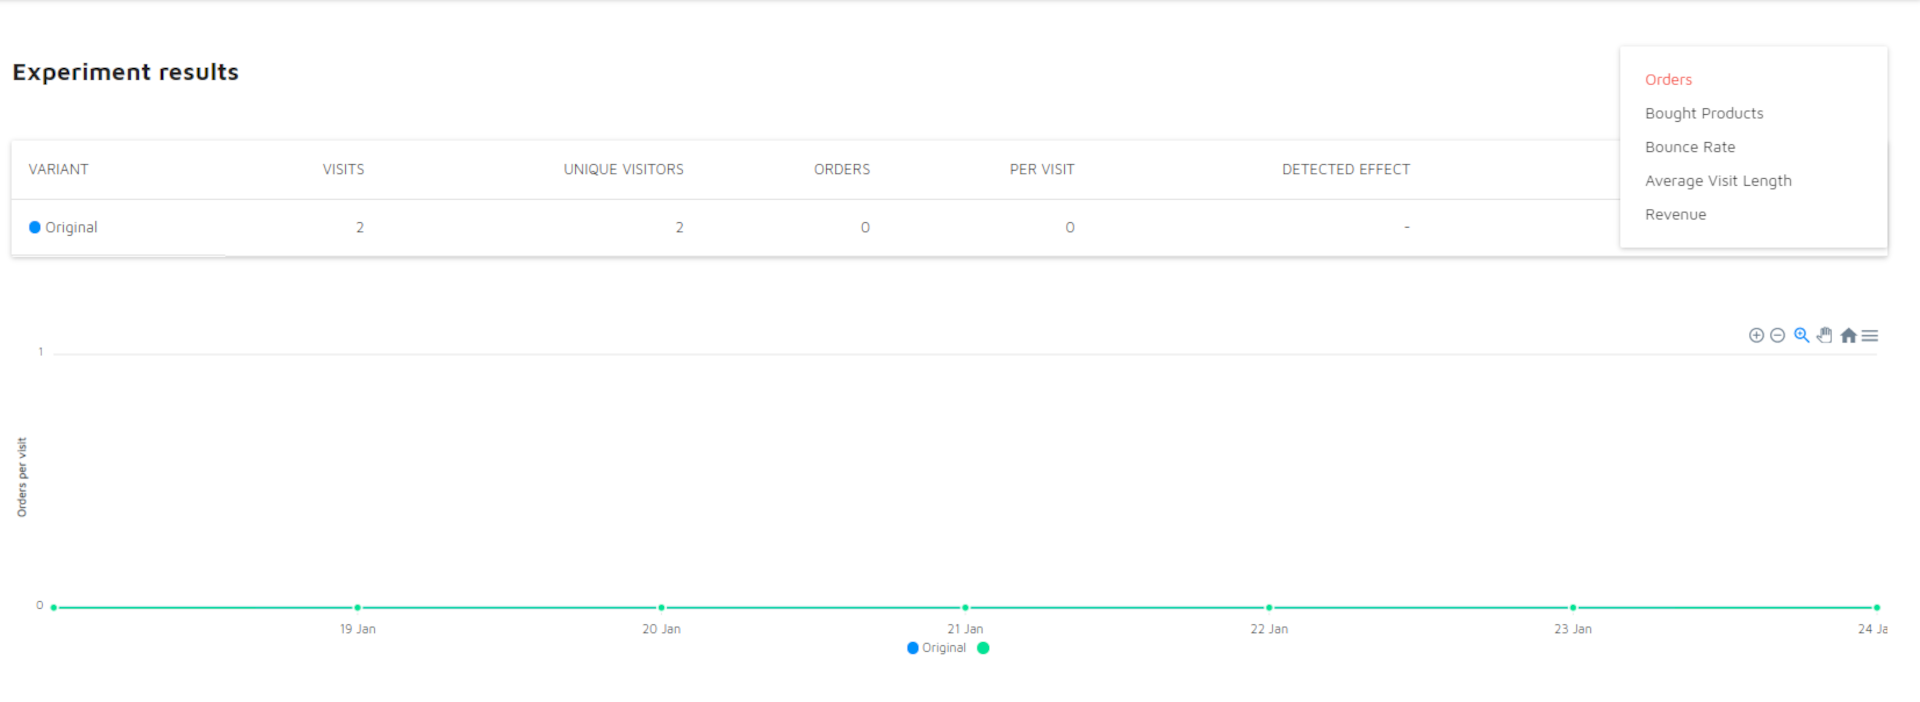
The result view has two parts that always refer to the same selected metric:
- a chart that shows how the metric developed over the course of the experiment, and
- a table that summarises the final numbers per variant.
All metrics are collected at all times, as long as tracking is set up correctly (see Requirements). You don't choose a "success metric" up front — every metric is measured for every variant and you switch between them freely in the result view.
Reading the results
Choosing the metric
At the top of the result view you pick which metric the chart and table should display. The same five metrics that are listed at the start of this page are available:
| Metric | What it measures |
|---|---|
| Orders | Number of completed ecommerce orders attributed to visitors of the variant. |
| Bought products | Number of individual products bought (Matomo "conversions"). A single order can contain several products. |
| Revenue | Total turnover (order value) generated by the variant, shown in your shop's currency (e.g. €). |
| Bounces | Bounce rate — the share of visits that left after seeing only one page, in %. |
| Average Visit Length | Average duration of a visit, in seconds. |
The result table
For the selected metric the table compares all variants side by side. Each column is one variant (A = original, B, and optionally C); each row is one value:
| Row | Meaning |
|---|---|
| Version | The variant label — A (the unchanged original), B, C. |
| Traffic split | The share of visitors routed to this variant, as configured at setup (e.g. 50 % / 50 %). Fixed for the whole experiment. |
| Unique Pageviews | Number of visits counted for the variant — the sample size the other numbers are based on. |
| Unique visitors | Number of distinct visitors in the variant. |
| <selected metric> | The absolute value of the chosen metric for the variant (e.g. total Orders, total Revenue in €, Bounces in %, Average Visit Length in s). |
| per visit | The metric normalised per visit, so variants with different traffic shares can be compared fairly (e.g. orders per visit, revenue per visit). This is the value you should compare between variants, not the raw total. |
| Proven impact | The relative change of this variant compared to the original (A), in %. A positive value means the variant performed better on this metric, a negative value means worse. Shown as - for the original itself. |
| Statistical significance | How confident Makaira is that the measured difference is real and not random noise, in %. Higher is better. It is shown as < 50 % when the data is still too thin to draw a conclusion (see note below). |
| Status | For configuration-based tests (ranking mix, personalization, recommendation), a set live button lets you promote a variant to the permanent live configuration. See Choosing a winner. |
"Unique" vs. non-unique counting. Wherever a metric carries the word unique, repeated activity within the same visit is collapsed into a single count; without it, every occurrence is added up.
- Unique visitors counts each distinct person once, even if they return in several separate visits.
- Unique Pageviews counts each visit that saw the page once, regardless of how often the page was reloaded or re-opened during that visit.
The unique counts are the meaningful sample size for an experiment — they tell you how many people / visits a variant actually reached, rather than how much raw activity occurred. The per visit and Proven impact figures are calculated against this unique base, which is why two variants with very different total activity can still be compared fairly.
Significance needs time. A statistical significance is only calculated once the experiment has been collecting data for at least 14 days. Before that, the significance for the B/C variants is shown as
-. Likewise, if a variant has too few visits, significance is capped and displayed as< 50 %. Treat any result with low significance as not yet decided — let the test run longer before acting on it.
The chart
The chart plots the selected metric per day over the duration of the experiment, with one line per variant. Around each line a confidence band (an upper and a lower bound) is drawn. The band expresses the uncertainty of the measurement: the more data is collected, the narrower it becomes.
How to read it:
- If the confidence bands of two variants still overlap, the difference between them is not yet reliable — the result could still flip.
- Once the bands separate clearly and stay apart, you can be confident the better-performing variant is genuinely ahead. This is the visual counterpart of the Statistical significance row in the table.
- A band that is still wide or jumping around indicates the metric is still noisy and needs more traffic.
Choosing a winner
For tests that change a Makaira configuration (ranking mix, personalization, recommendation), the result table shows a set live button in the Status row. Clicking it promotes the chosen variant's configuration to the permanent live setting and ends the experiment. Only one variant can be set live per experiment.
Pure frontend tests have no Makaira-side configuration to promote, so they have no set live button — you implement the winning variant in your storefront code yourself. Landing page tests use a dedicated set live flow described in A/B Experiments for Landing Pages.
A/B testing in the frontend
Storefront
A helper function is available in the storefront that allows elements to be displayed or hidden based on the group assigned to the user.
This requires that the experiment IDs and variant IDs to be used are known at implementation.
Example:
function ExperimentTestComponent() {
  const { isInExperiment } = useAbTesting()

  if (isInExperiment({ id: 99, variation: 'Original' })) {
    return <span>Original implementation</span>
  } else if (isInExperiment({ id: 99, variation: 'B' })) {{
    return <span>Implementation of testcase B</span>
  } else if (isInExperiment({ id: 99, variation: 'C' })) {{
    return <span>Implementation of testcase C</span>
  }
}Updated 5 months ago