Dashboard
The Makaira Dashboard serves as the central control panel for navigating and managing the various applications and functionalities within the Makaira platform. It is organized into distinct sections, grouping related tools to provide a clear and intuitive user experience.
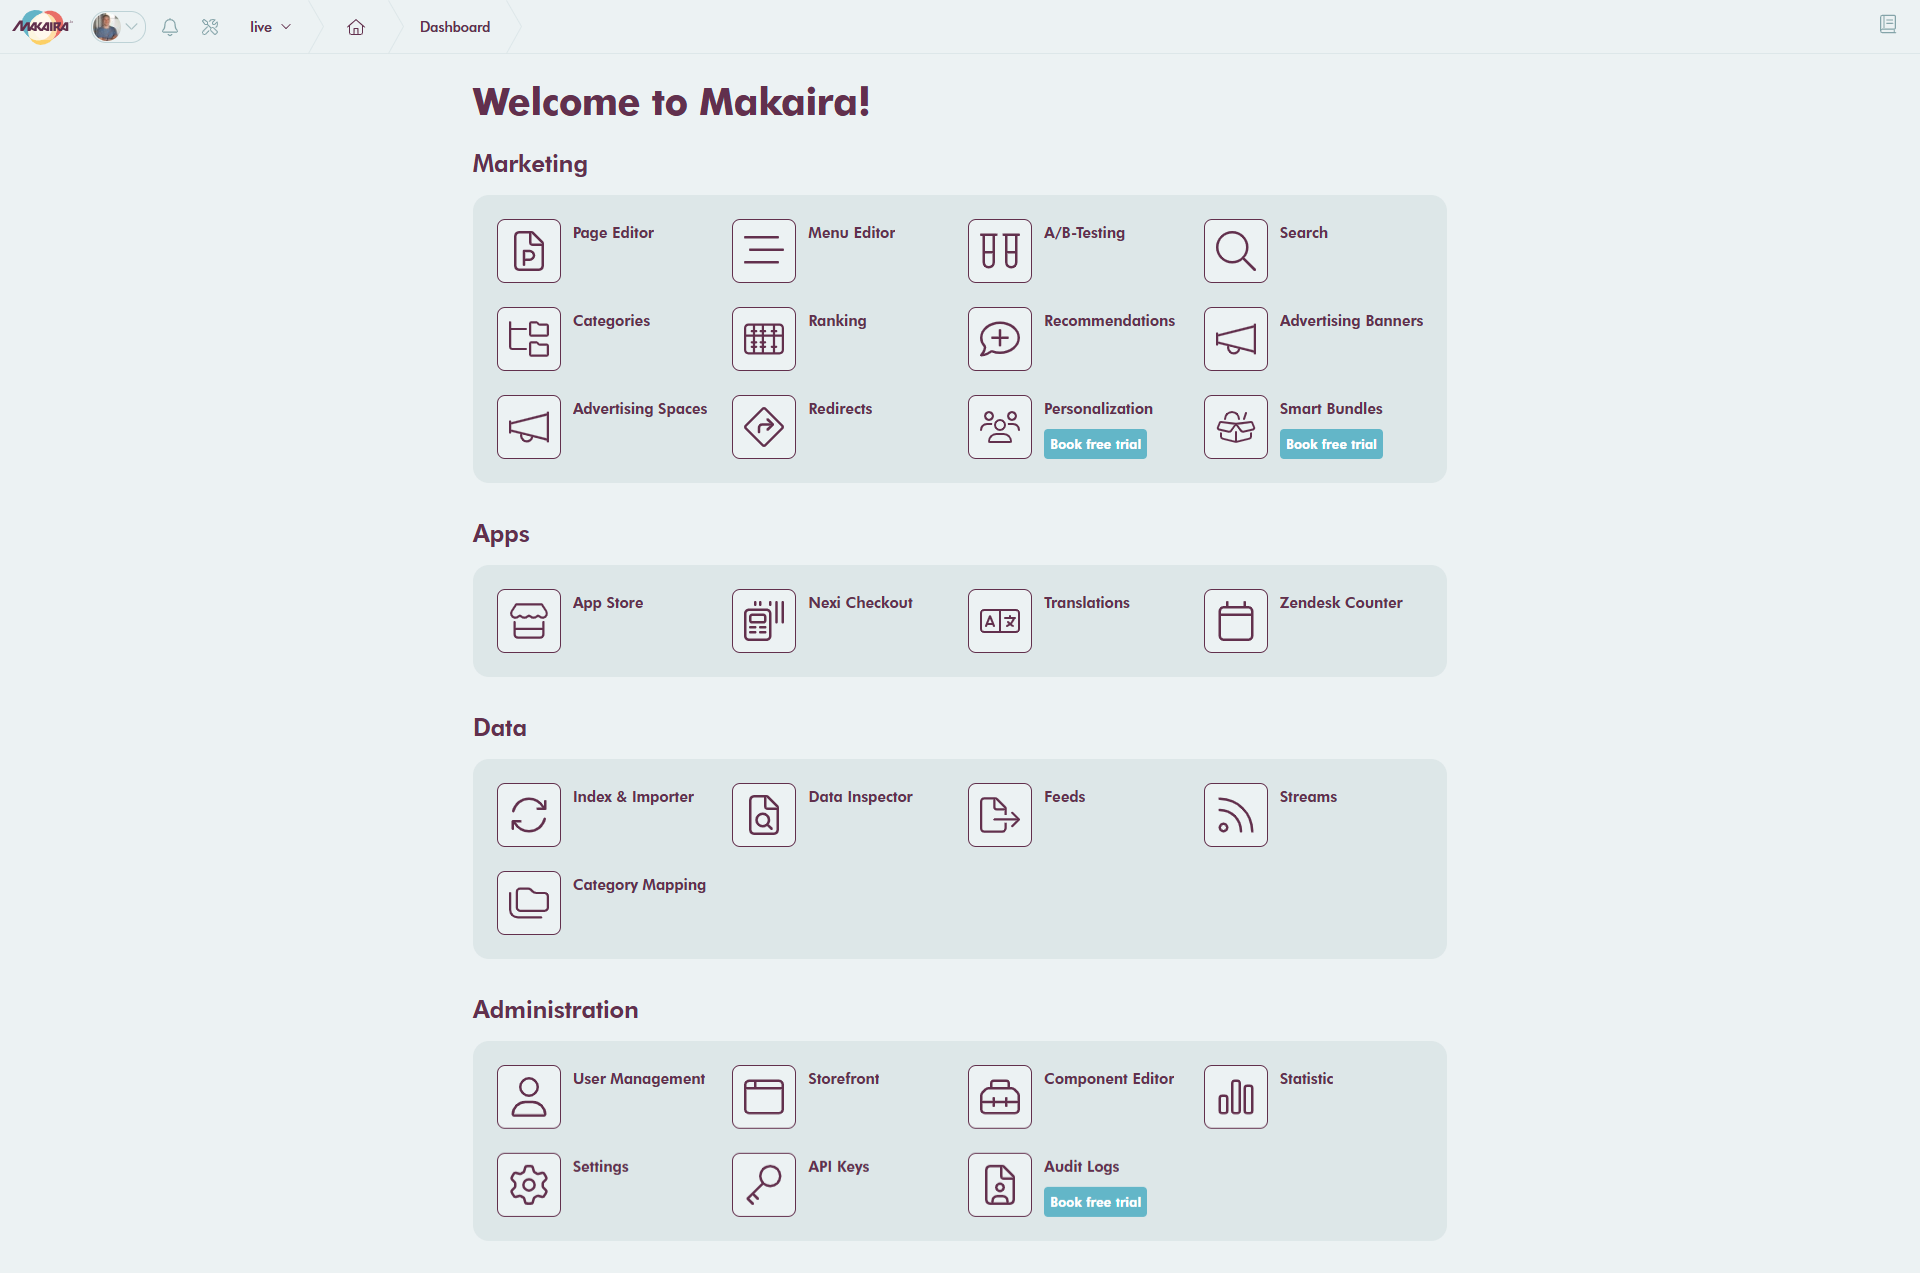
The dashboard features the following main grouping sections:
1. Marketing
This section contains all the tools dedicated to e-commerce marketing and content management. These tools enable users to control the visual presentation, promotional strategies, and search optimization of their online store.
- Page Editor
- Menu Editor
- A/B-Testing
- Search
- Categories
- Ranking
- Recommendations
- Advertising Banners
- Advertising Spaces
- Redirects
- Personalization
- Smart Bundles
2. Apps
This section is focused on external and core applications that enhance the platform's capabilities, particularly around checkout and language features.
- App Store
- Nexi Checkout
- Translations
- Zendesk Counter
3. Data
This group houses tools essential for managing, monitoring, and importing data. It provides control over the flow and structure of product and category information within the system.
- Index & Importer
- Data Inspector
- Feeds
- Streams
- Category Mapping
4. Administration
This section includes critical tools for platform configuration, security, and user access. It is the control center for managing the technical and human resources aspects of the Makaira installation.
- User Management
- Storefront
- Component Editor
- Statistic
- Settings
- API Keys
- Audit Logs
The tiles can have labels indicating that you are not yet using the app. In this case, you can:
- Book app for purchasing
- Book free trial for 30-day testing
On hover, a button with three dots appears to get more information about the app.
Updated 5 months ago